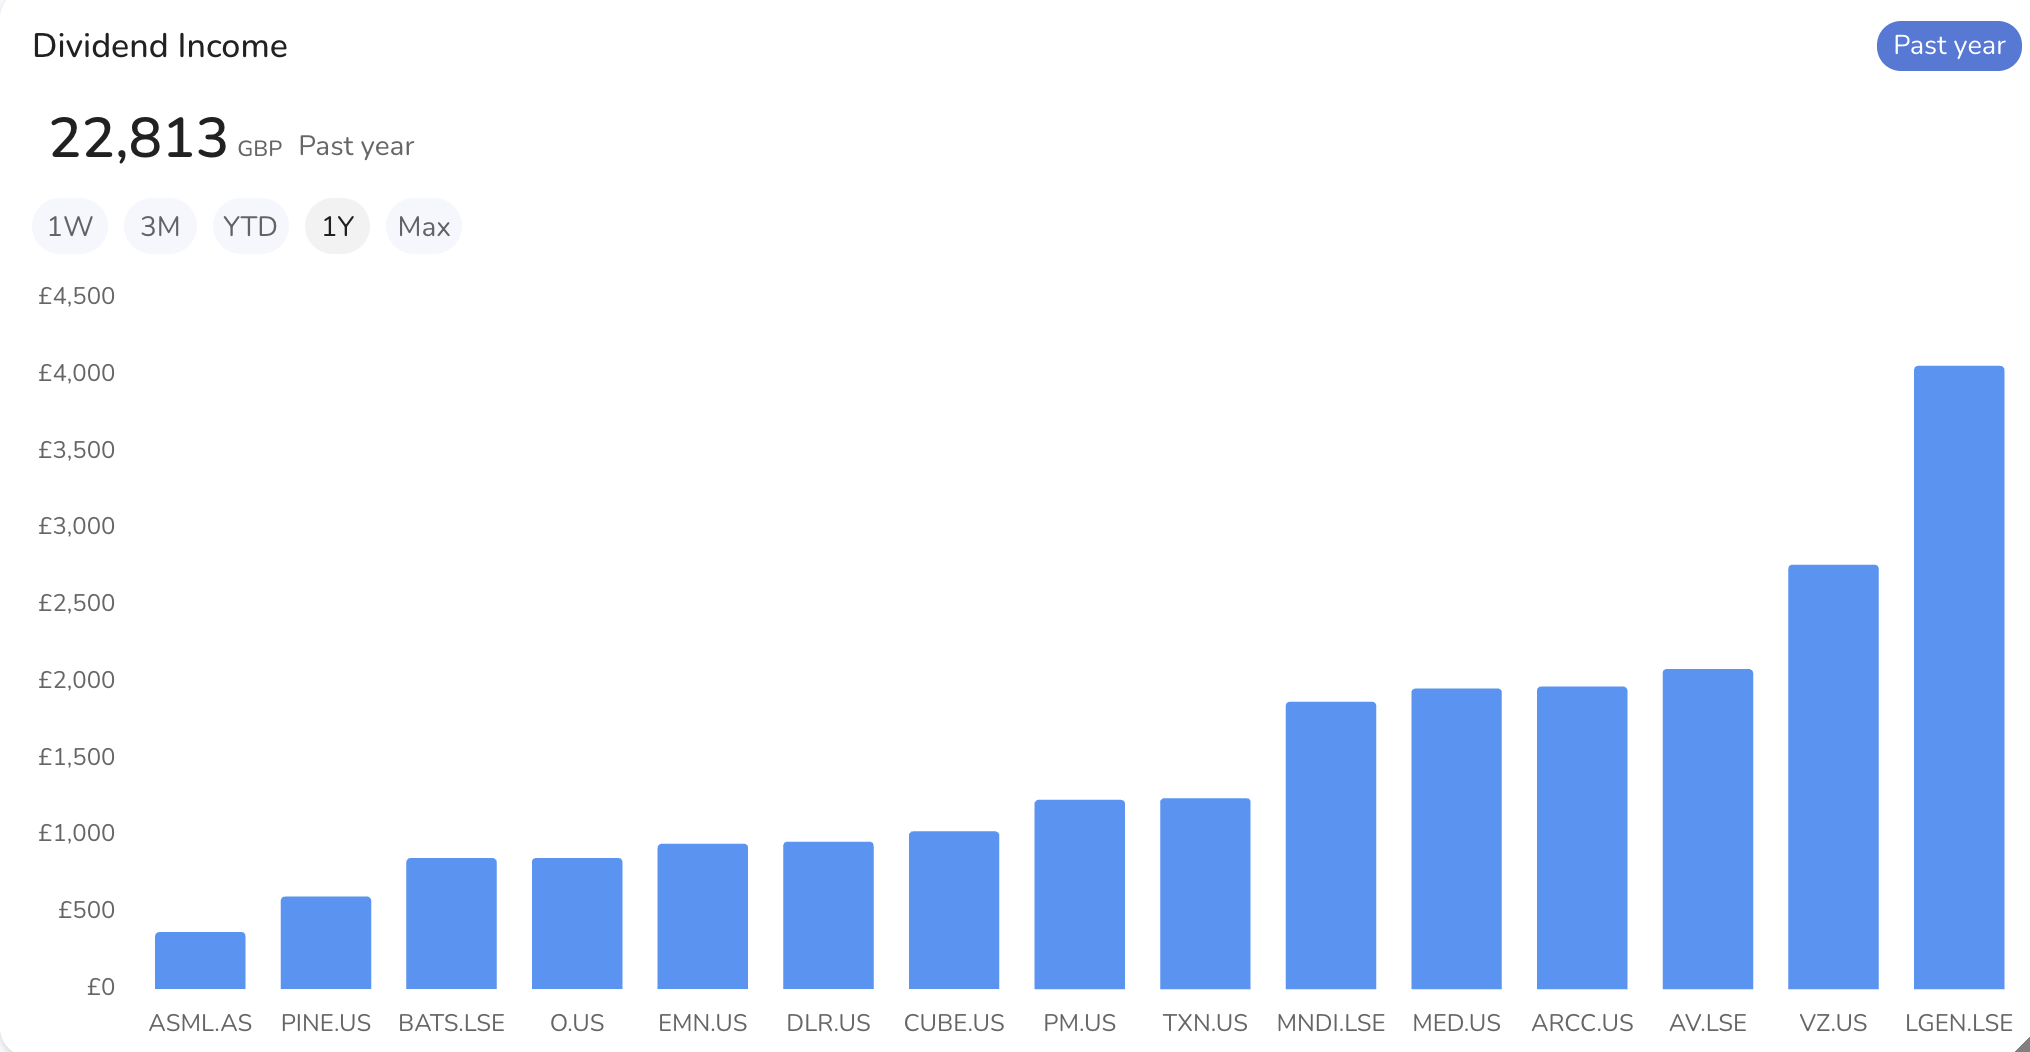
Dividend Income per Holding

Overview
The Dividend Income per Holding widget displays the dividend income generated by each individual stock in your portfolio. This visual representation helps you understand the income contribution of each holding. You can view the income over different time intervals, and the chart can be customized to show either vertical or horizontal bars, depending on the settings you choose.
Data Displayed
- Total Dividend Income:
- Shows the total dividend income for the selected time period (e.g., 1W, 3M, YTD, 1Y, Max).
- Displayed at the top of the widget in your chosen currency (e.g., GBP).
- Income per Holding:
- Each bar represents the amount of dividend income received from a specific stock.
- The length of the bar indicates the amount of income, making it easy to compare different holdings.
Settings
- Accessing Settings:
- Click on the settings icon to open the settings menu.
- General Settings:
- Display Past Holdings: Toggle to show or hide past holdings in the chart.
- Show Header: Toggle to show or hide the header of the widget.
- Show Label: Toggle to show or hide labels on the bars in the chart. Labels display the dividend amount for each holding.
- Chart Orientation:
- By default, the chart displays vertical bars. If you toggle the "Show Label" setting, the bars will be displayed horizontally with labels.
Saving Changes
- After entering all the necessary information, click "Save" to apply your changes.
- Buttons:
- Default: Resets the settings to default values.
- Cancel: Discards any changes made.